Blessings Real 😎
Hopefully this awesome new ambient vibe from Blume helps to get you in the right frame of mind for a chill day/night ahead. Because unfortunately, it's time to unleash a bit more of the science beasty within you, and a mellow track like this might just be your only saviour from utter nerdific-insanity.
I make no apologies 😏
NICER Project: The Whole Shabang (12 Studies)
Here's where you can find links to the full research thesis online (free access), as well as the summaries I posted with more scientific-based explanations full of all the geek you could want. So... have at it you geekoids-in-hiding!
The Different Subgroups
If you've been following along, then you'll also know that I started the ball rolling with an outline of the ways I broke up the data into different groups, to allow us to see all the new trends for the first time. Here's a link to that explanation.
Patients Without MI
The first study we looked at covered data from patients without MI (MI stands for myocardial infarction, which is a term used by scientists and clinicians to describe damage to the heart that might happen with events that are commonly referred to as heart attacks, for example). That data showed some of the first exciting new trends (link to the right).

Patients With MI
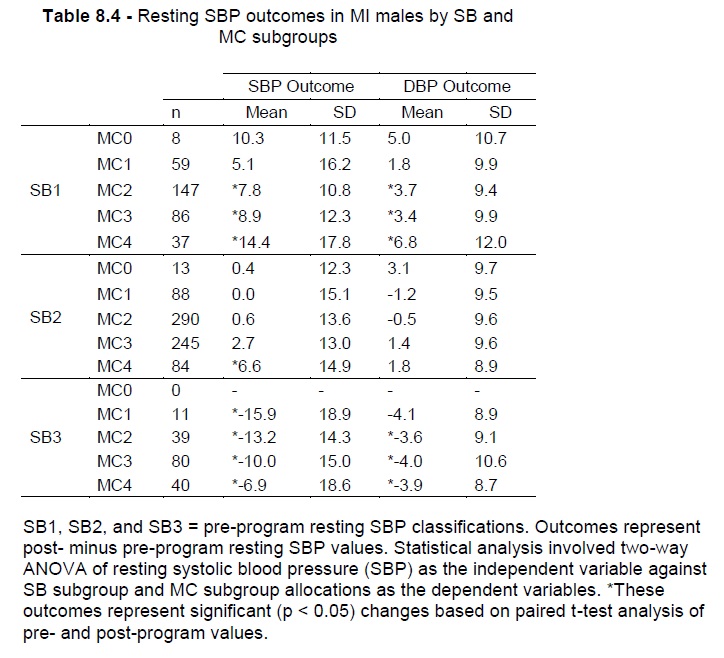
So today, we'll look at the results from patients with MI (i.e. damage to the heart muscle), as shown to the left. If we put on our geek for just a bit, and look at the second column of numbers, we see average outcomes (changes) in these patients based on the specific subgroups. Notice how the numbers in SB1 patients (those who started with low blood pressure) are positive (meaning that they had average increases in blood pressure after the rehabilitation program)? Now look at the bottom groups (SB3, with pre-program higher blood pressures), and notice how those patients had lower average pressure after the program. This is the same as we saw for patients without MI too. There are other results in that table as well, but let's just focus on this column for now.
Let's just mention one more trend here for now. Do you see how in the SB1 patients, the outcomes (changes) seemed to get higher for patients in the MC4 group than in MC3 or MC2? And if you look at the SB3 patients, notice how that trend looks like it might be reversed? Well if you see that, you have officially been geekified beyond repair 🤯 and your mind will never be the same again. Feel the nerdalicious pain!
Yes, in patients with low blood pressure before the program seem to have greater increases in their blood pressure after the program with the more metabolic syndrome conditions they have, while patients with high pre-program blood pressure show the opposite. If you want to know why, read the full description in the links above. A word of caution though: larger groups would help to show these results even more clearly, but groups that large are much harder to find.
I'll make you suffer even more, and with equally painful levels of brain mashing geek, in the rest of our look at the remaining studies of the NICER project. For now, I'll end your initiation into the world of science here. I have evil-ed enough tonight 😈


Hopefully you've been following along closely enough with the PAPE framework and all this science stuff from the NICER project too, so you can start to understand why all the new R&D work and app development projects are necessary, as well as the new upcoming books.
They're kind of important. Even for us un-geeks.
I mean seriously, how nerdy are the crazies that got all that stuff up there. Total science-loving bunch of weirdos.
Yes you. Admit it!
Don't worry. Still love ya'.
But stand over there, yeah?
No, further 😉
Stay awesome,
EMH
