Peak Outcomes in MI Patients
Results
Key Demographics
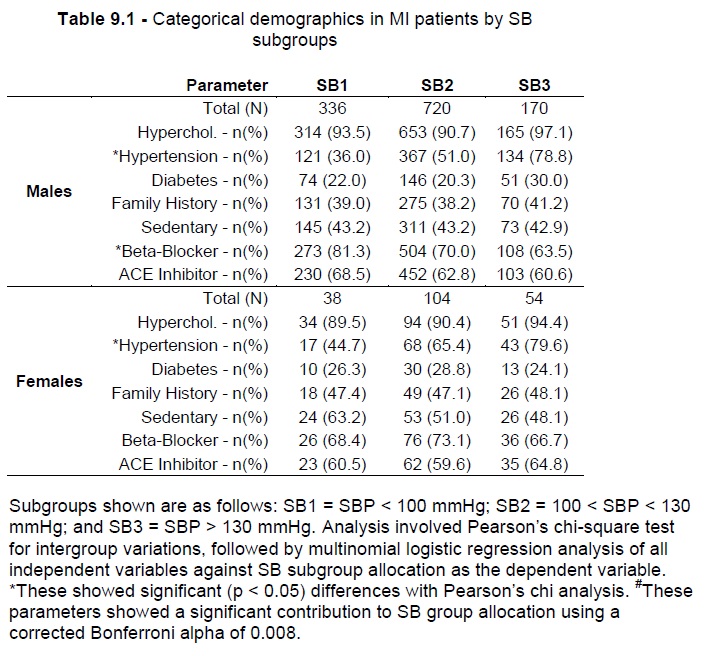
Hypertension and BB use varied significantly across SB subgroups in males, while only hypertension varied significantly between SB subgroups in females (Table 9.1, p < 0.05). Gender-based multinomial logistic regression using all of the independent variables shown in Table 9.1, with SB subgroup allocation as the dependent variable, showed that the full model containing all predictors was statistically significant in males (2 = 147.3, p<0.001) but not in females (p > 0.05), with the model explaining 11.3% to 13.4% (Cox & Snell R2 and Nagelkerke R2) of the variance in SB subgroup allocations in males. Only the prevalence of hypertension diagnosis contributed significantly (p < 0.001) to SB subgroup allocation in either gender (Table 9.1, p < 0.001).

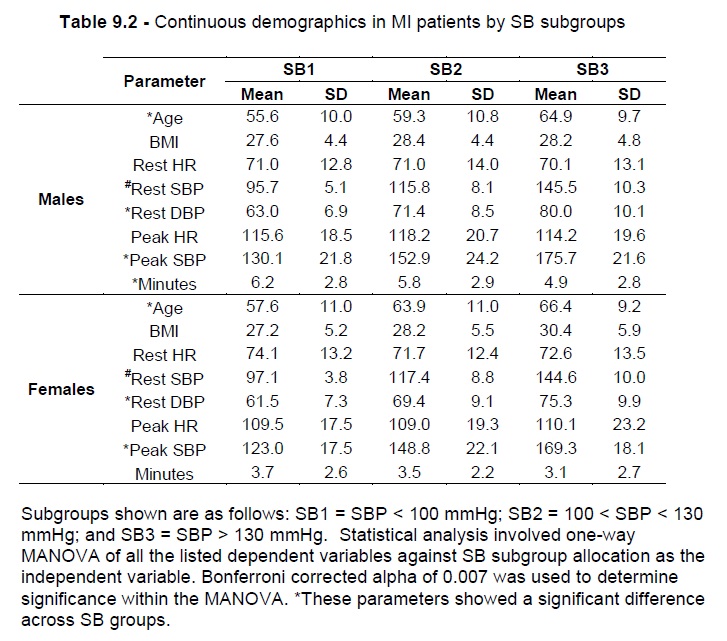
Table 9.2 summarises the continuous demographic variables (age, BMI, resting HR, SBP and DBP, peak HR and SBP, and minutes during EST assessment) for the data sample in the present study based on gender and SB subgroups. One-way MANOVA analysis, using SB subgroup allocation as the categorical dependent variable and the continuous demographic parameters above (excluding rest SBP) as the independent variables, showed that age, resting DBP, and peak SBP variables showed significant variance across SB subgroups in both genders, while EST minutes showed significant variance only in males (based on a Bonferroni adjusted alpha value of 0.007). In males, resting DBP (Table 9.2, Effect size = 0.292, p < 0.001) was followed by peak SBP (Table 9.2, Effect size = 0.276, p < 0.001) as the parameters most influenced by SB group allocation. This was reversed in females with peak SBP (Table 9.2, Effect size = 0.378, p < 0.001) being followed by rest DBP (Table 3, Effect size = 0.213, p < 0.001) as the parameters most influenced by SB group allocation. The model showed a statistically significant difference between SB subgroups based on the combined dependent variables in males (Wilks’ Lambda = 0.478, Effect size = 0.309, and p < 0.001) and females (Wilks’ Lambda = 0.441, Effect size = 0.336, and p < 0.001).

Effect on Peak HR
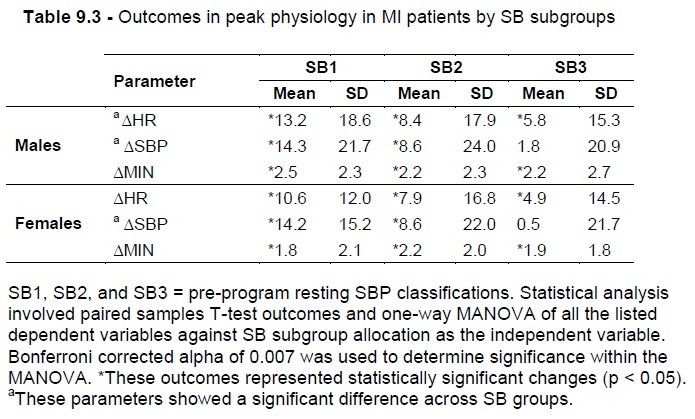
From SB1 to SB3 subgroups, males showed progressively lesser peak HR increases (Table 9.3: N = 336 and ΔHR = 13.2 bpm, and SD = 18.6 for SB1; N = 170, ΔHR = 5.8 bpm, and SD = 15.3 for SB3, respectively with p < 0.001). Females also showed progressively lesser peak HR increases ranging from SB1 to SB3 subgroups. (Table 9.3: N = 38 and ΔHR = 10.6 bpm, and SD = 12.0 for SB1; N = 54, ΔHR = 4.9 bpm, and SD = 14.5 for SB3, respectively with p < 0.001). One-way MANOVA comparison of SB subgroups showed that SB subgroup allocation had an Effect size on peak HR outcomes of 0.020 in males (Table 9.3, p < 0.001). SB subgroup allocation was not shown to significantly influence Peak HR outcomes in females (Table 9.3, p > 0.05).

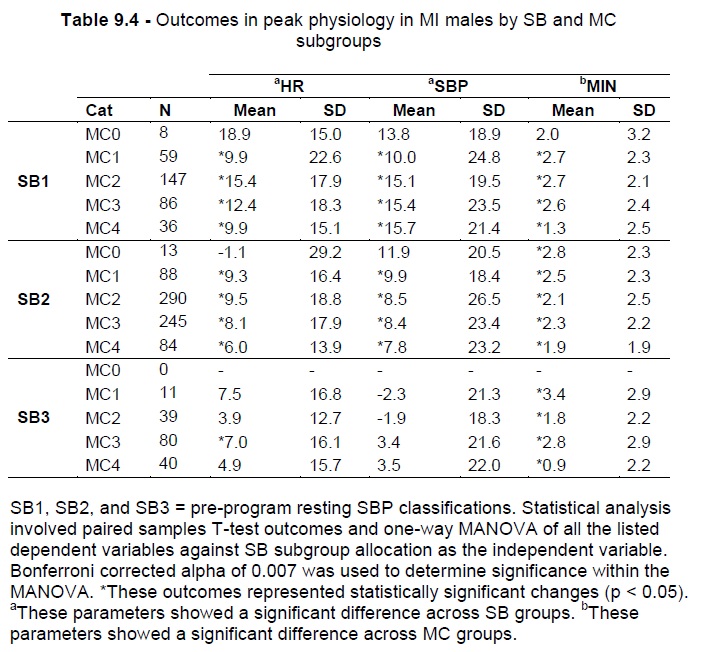
In males: (a) within the SB1 subgroup, the greatest Peak HR increases were shown for the MC2 group (Table 9.4, N = 147, ΔHR = 15.4 bpm , SD = 17.9, p < 0.01); (b) within the SB2 subgroup, increases in peak HR were achieved by MC1 (Table 9.4, N = 88, ΔHR = 9.3 bpm, SD = 16.4, p < 0.001) to MC4 (Table 9.4, N = 84, ΔHR = 6.0 bpm, SD = 13.9, p < 0.001) patients; (c) within the SB3 subgroup, significant changes in peak HR were achieved by MC3 patients (Table 9.4, N = 80, ΔHR = 7.0 bpm, SD = 16.1, p < 0.05). Two-way MANOVA of Peak HR outcomes in males based on SB and MC subgroup allocations showed that SB subgroup allocation influenced Peak HR outcomes (Table 9.4, Effect size = 0.014, p < 0.05), but MC group allocation did not (p > 0.05).

Effect on Peak SBP
From SB1 to SB2 subgroups, males showed lesser peak SBP increases (Table 9.3: N = 336, ΔSBP = 14.3 mmHg, and SD = 21.7 for SB1; N = 720, ΔSBP = 8.6 mmHg, and SD = 24.0 for SB2, respectively with p < 0.001). Males classified SB3 did not show significant peak SBP changes (Table 9.3, p > 0.05). Females also showed lesser Peak HR increases ranging from SB1 to SB2 subgroups. (Table 9.3: N = 38, and ΔSBP = 14.2 mmHg, and SD = 15.2 for SB1; N = 104, ΔSBP = 8.6 mmHg, and SD = 22.0 for SB2, respectively with p < 0.001), with no significant changes in SB3 females (Table 9.3, p > 0.05). One-way MANOVA comparison of SB subgroups
showed that SB subgroup allocation had an Effect size of 0.027 on Peak SBP outcomes in males, and an Effect size of 0.051 in females (Table 9.3, p < 0.001).
In males: (a) within the SB1 subgroup, the greatest peak SBP increase was seen in the MC4 group (Table 9.4, N = 36, ΔHR = 15.7 mmHg , SD = 21.4, p < 0.05) with the lowest peak SBP outcome seen in MC1 patients (Table 9.4, N = 59, ΔSBP = 10.0 mmHg, SD = 24.8, p < 0.01); (b) within the SB2 subgroup, increases in peak SBP ranged from MC1 (Table 9.4, N = 88, ΔSBP = 9.9 mmHg, SD = 18.4, p < 0.001) to MC4 (Table 5, N = 84, ΔSBP = 7.8 mmHg, SD = 23.2, p < 0.001) patients; (c) within the SB3 subgroup, no changes in peak SBP were statistically significant (Table 9.4, p > 0.05). Two-way MANOVA of peak SBP outcomes in males based on SB and MC subgroup allocations showed that SB subgroup allocation influenced peak SBP outcomes (Table 9.4, Effect size = 0.018, p < 0.001), but MC group allocation did not (p > 0.05).
Effect on EST Minutes
Males showed increases in EST minutes of between ΔMins = 2.5 mins for SB1 (Table 9.3, N = 336, SD = 2.3, p < 0.01) and ΔMins = 2.2 mins for SB3 (Table 9.3, N = 170, SD = 2.7, p < 0.01). Females also showed increases in EST minutes ranging from ΔMins = 2.2 mins in SB2 (Table 9.3: N = 104, SD = 2.0, p < 0.01) to ΔMins = 1.8 mins in SB1 (Table 9.3, N = 38, SD = 2.1, p < 0.01). Although one-way MANOVA analysis showed that SB allocation alone did not influence outcomes in EST minutes (Table 9.3, p > 0.05), two-way MANOVA with SB and MC allocations combined showed that MC allocation in this model has an Effect size = 0.024 on outcomes in EST minutes (Table 9.4, p < 0.001).
Discussion
Overview
To summarise the main findings: (a) SB group allocations affected outcomes in peak HR and peak SBP in males, but not in EST Minutes; (b) SB group allocations affected outcomes in peak SBP only in females; (c) after correcting for SB groups, MC subgroup allocations had no further influence on peak HR or peak SBP, but did significantly affect the variance in EST minute outcomes; (d) males and females showed progressively lower peak HR and peak SBP outcomes from SB1 to SB3 groups, while outcomes in EST minutes were variable; (e) all outcomes represented increases from pre-program values.
Important Demographics
Significant pre-program variations across SB groups were shown for age, rest SBP and DBP, peak SBP and EST minutes (in males only). All but the last of these increased consistently from SB1 to SB3, with EST minute outcomes decreasing from a maximal value in SB1 patients. Based on this pre-program data, MI patients admitted to the CR program and assessed at rest as hypertensive during pre-program assessment were generally older, had higher resting blood pressure, showed a significantly higher peak BP and achieved the lowest durations during EST testing. These variations are similar to data in non-MI patients (see Chapter 5) and help to confirm the value of SB grouping to effectively correct for as much of this multi-parameter variation as possible when analysing physiological outcomes.
Diagnosed hypertension varied as expected between SB groups in both genders. Additionally, BB use varied significantly in males only.
However SB groups are based on the measured blood pressure at the time of pre-program assessment rather than a prior diagnosis of hypertension. Thus the 36.0% of SB1 male and 44.7% of SB1 female patients with previously diagnosed hypertension and assessed during pre-program testing to be hypotensive (i.e. systolic BP below 100 mmHg) are noteworthy here as was the case with non-MI patients. It is possible that CHF (with it’s characteristic compromise in LVEF potentially affecting SBP) has developed in some patients following their MI, which may potentially explain some of these data [167]. The effect of medications on physiological outcomes is examined further in Chapter 13, with findings there suggesting that when taken with BB medication, ACEI use may limit peak SBP outcomes in both males and females. When combined with the relatively high number of hypotensive SB1 patients taking ACEI medications (68.5% of males and 60.5% of females) and the high numbers with a prior diagnosis of hypertension, the data suggest that a review of BB and ACEI medications for patients entering CR may be necessary. This medication review may improve peak HR and SBP outcomes.
Outcomes in Peak Physiology
Based on SB group allocations, the present results show that peak HR (in males) and peak SBP (in males and females) varied predictably in MI patients as in non-MI individuals (see Chapter 5). In clinical significance terms, we can compare genders across SB groups to reveal that peak HR and peak SBP were consistently graded in both genders, with SB1 males and females achieving the greatest outcomes.
While pre-program peak SBP varied between SB groups in males and females, peak HR did not vary significantly in either gender based on the one-way MANOVA results in Table 9.3.
Furthermore, although pre-program EST durations varied between SB groups in males, the variation in females was not statistically significant. These pre-program demographics make the relatively little variation in EST Minute outcomes in males and females noteworthy. Peak SBP and DBP, and changes in these from rest, are all higher in men during maximal treadmill EST [172] and increase with advancing age. Differences in EST parameters including HR and HRR1 between genders have been shown, and may partially explain differences in exercise capacities [173]. Another important factor to consider is the effect of overweight and obesity on these outcomes, with evidence [174] showing that exercising on the treadmill while carrying loads (15 and 20 kg) may produce fatigue quicker in women, and increase the risk of adverse cardiovascular events more significantly in females. The HR-corrected QT interval (QTc) is longer in females, but QT dispersion (QTd) is higher in males, based on EST in hypertensive patients [175].
Autonomic regulation has also been shown to differ significantly between genders [176], with a dominance of sympathetic vascular regulation in men and parasympathetic regulation of HR in women. These as well as many other potential factors may result in the gender-based differences in the present outcomes. While MC subgroup allocations had a statistically significant effect on rest SBP outcomes in non-MI patients when combined with SB group allocation, the present findings show that there was no significant difference in peak SBP or peak HR based on these same allocations. However MANOVA analysis does not reveal the apparent and clinically significant peaking trends in peak HR (maximal values shown for MC2 patients in both the SB1 and SB2 groups) and EST minute outcomes in SB1 and SB2 Males based on MC subgroups. Such trends suggest that the combined SB and MC classifications may clarify outcome interpretation in clinical CR settings.
Implications for Clinical Practice
Exercise can improve flow-mediated dilation (FMD) in CAD patients [177], and combined hypertension and DM somewhat limit changes in FMD, but not necessarily fitness, body composition or glycaemic control [153]. Further complicating the interpretation of peak SBP outcomes are results in healthy individuals suggesting that a negative relationship may exist between exercise intensity and FMD [178]. Normotensive males with Met-S have also been shown to demonstrate exercise-induced hypertension (EIH), with the best predictors of EIH occurrence being resting SBP and abdominal obesity [179]. Stratification of peak SBP outcomes within SB1 and SB2 (albeit reversed in the latter) subgroups in the current findings may be a reflection of the effects of Met-S on LV morphology independent of age and gender [180], with LV systolic dysfunction further compounded in hypertensive patients [181]. Met-S may also complicate many homeostatic mechanisms as we have discussed previously, including autonomic function and in particular sympathetic mechanisms [182] potentially affecting CVS function. The present MC classification system requires clarification of the differing effects of various combinations of comorbidities, which is a limitation of the current study. Analysis of larger sample sizes in similar manner would provide greater statistical power for more in-depth analysis.
With the exception of a slight difference in peak HR, normotensive SB2 males and females showed very similar outcomes in peak physiology. Males showed relatively consistent post-program increases in EST durations across SB groups. The current findings suggest we can confidently expect lesser outcomes in peal HR and SBP in patients with higher pre-program resting SBP. Thus despite apparent gender-based differences in physiology, sustaining an MI appears to equalise physiological outcomes between normotensive males and females.
It is also important to note that the stratification of peak SBP outcomes based on MC groups seen here in MI patients is the reverse order of that seen in non-MI patients (see Chapter 5). That is, non-MI SB1 patients showed lower peak SBP outcomes post-program as one moves from MC0 to MC4, while the opposite is true in SB1 patients with MI. In SB2 patients, those with no history of MI showed higher outcomes moving from MC0 to MC4, while this is again reversed in MI patients. To the best knowledge of the present author, this study is the first to demonstrate these contrasting outcomes based on a combination of MI history and MC classification.
The altered trend in outcomes following an MI event may potentially be due to the central limitations imposed by the ischemic damage to the heart’s myocardium as a result of the MI, thereby shifting the focus of adaptations more towards the periphery. Thus in hypotensive SB1 patients, an MI event (centrally) and increased MetS comorbidity (systemically) pre-program may be expected to more significantly limit functional capacity pre-program, which leads to greater outcomes in these patients post-program as the CR training reduces these limitations. While the peak SBP outcomes in MI patients appear generally lower than those in non-MI patients (likely due to the central limits imposed by ischemic myocardial damage), the reversal of the MC-based trends may represent the extent to which comorbidities may have been exerting an impact on patients who eventually experienced an MI event. That is, these outcome differences could perhaps be related to the susceptibility of individuals to physiological abnormalities preceding an MI event, with a difference in this susceptibility between the non-MI (lower) and MI (higher) patients.
Comparing outcomes across genders is not straightforward, as various differences discussed previously and in later sections complicate any direct comparisons. In addition to factors already mentioned, gender differences in postural autonomic function with reduced BRS in both genders with age [183] have been demonstrated. The cardiac output and VO2max relationship is similar in both genders at lower exertion levels, but the actual slope of the linear regression is different with men showing overall higher VO2max increases at higher levels of exertion [184] for the same increase in cardiac output. Female gender though has been shown to be a predictor of better LV function in hypertensive patients with LV hypertrophy [185]. There is evidence to suggest that Met-S may compromise FEV1 and FVC, but not FEV1/FVC ratio [57], leading to the development of restrictive lung disease in susceptible individuals. One potential mechanism for this association is inflammation, directly impacting the gas exchange across the alveolar epithelia and pulmonary capillary wall. Whilst such evidence reveals the potential effects of Met-S on systems directly related to aerobic functional capacity, further evidence suggests that common complications presenting to CR may compound the negative effects of Met-S and CVD.
Thus all of these additional factors may be contributing to some of the observed differential outcomes between genders. Patients were able to tolerate elevated peak HR and SBP, and increased EST time, following the investigated IT intervention. However one may instead aim to increase the workload while reducing the cardiovascular burden during exertion. This would signal better physiological efficiency and may be more desirable in a rehabilitation context. This rationale seeking improved increased physiological efficiencies at rest and during exertion is applied within the NICER intervention (see Chapter 15).
Conclusion
The present study demonstrates some of the effects of an MI event on clinical CR outcomes when corrections are made for pre-program resting SBP and MC group allocation. A reversal of some trends was noted in peak HR and peak SBP (based on the combined SB and MC allocations) in MI patients compared with non-MI individuals. These novel trends help inform outcome interpretation in MI patients.
