Peak Outcomes in Non-MI
Results
Key Demographics
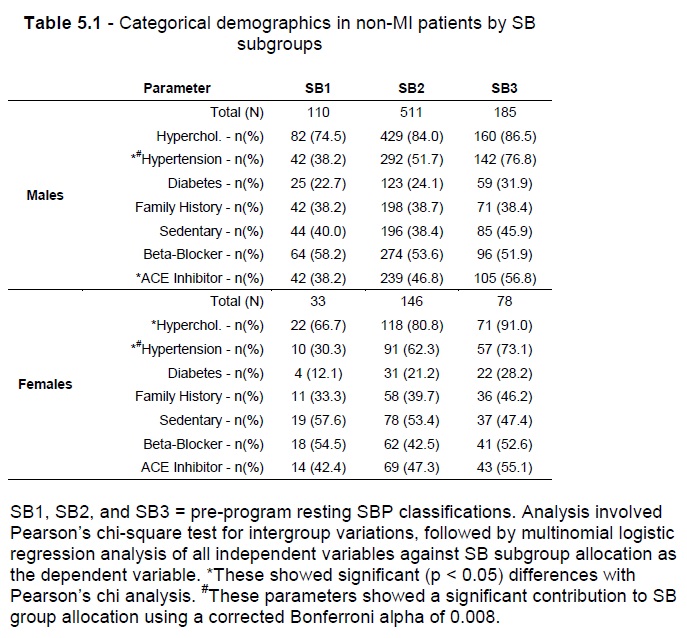
Hypertension and ACEI use varied significantly across SB subgroups in males, while hypercholesterolemia and hypertension varied significantly between SB subgroups in females (Table 5.1, p < 0.05).

Gender-based multinomial logistic regression using all of the independent variables shown in Table 5.1, with SB subgroup allocation as the dependent variable, showed that the full model containing all predictors was statistically significant in males (2 = 51.6, p<0.001) and females (2 = 30.4, p<0.001), with the model explaining 6.2% to 7.4%, and 11.2% to 13.1% (Cox & Snell R2 and Nagelkerke R2) of the variance in SB subgroup allocations in males and females respectively. Only the prevalence of hypertension diagnosis contributed significantly (p < 0.001) to SB subgroup allocation in either gender (Table 5.1).
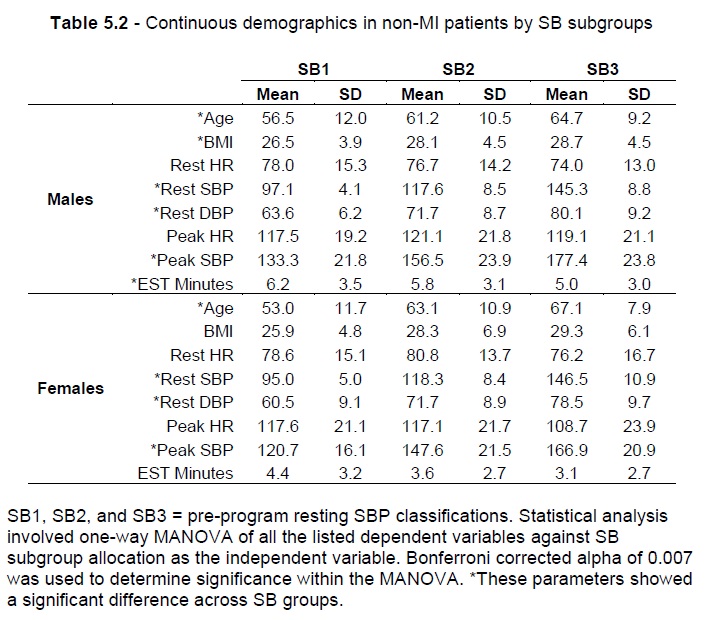
Table 5.2 summarises the continuous demographic variables (age, BMI, resting HR, SBP and DBP, peak HR and SBP, and Minutes during EST assessment) for the data sample in the present study based on gender and SB subgroups. One-way MANOVA analysis, using SB subgroup allocation as the categorical dependent variable and the continuous demographic parameters above (excluding Rest SBP) as the independent variables, showed that age, resting DBP and Peak SBP variables showed significant variance across SB subgroups, while pre-program BMI and EST Minutes showed significant variance only in males (based on a Bonferroni adjusted alpha value of 0.007).
In males, resting DBP (Table 3, Effect size = 0.253, p < 0.001) was followed by Peak SBP (Table 5.2, Effect size = 0.235, p < 0.001) as the parameters most influenced by SB group allocation. This was reversed in females with Peak SBP (Table 5.2, Effect size = 0.316, p < 0.001) being followed by Rest DBP (Table 5.2, Effect size = 0.053, p < 0.001) as the parameters most influenced by SB group allocation. The model showed a statistically significant difference between SB subgroups based on the combined dependent variables in males (Wilks’ Lambda = 0.539, Effect size = 0.461, and p < 0.001) and females (Wilks’ Lambda = 0.494, Effect size = 0.506, and p < 0.001).

Effect on Peak HR
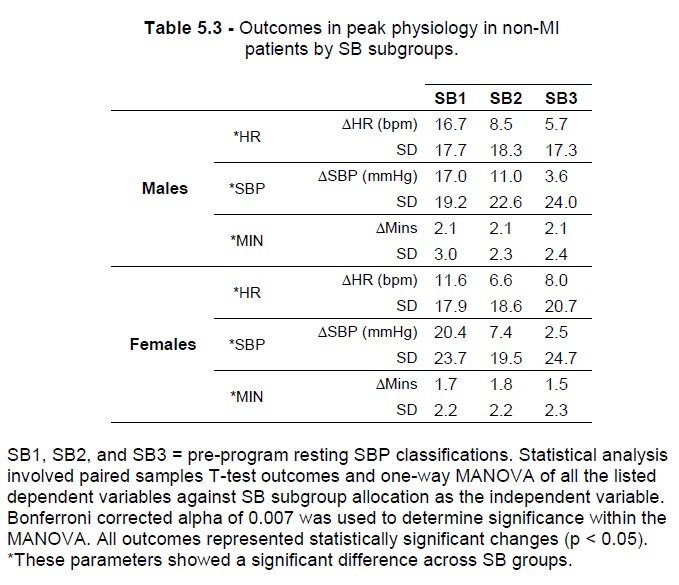
From SB1 to SB3 subgroups, males showed progressively lesser Peak HR increases (Table 5.3: N = 110 and ΔHR = 16.7 bpm, and SD = 17.7 for SB1; N = 185, ΔHR = 5.7 bpm, and SD = 17.3 for SB3, respectively with p < 0.001). Females also showed progressively lesser Peak HR increases ranging from SB1 to SB3 subgroups. (Table 5.3: N = 33 and ΔHR = 11.6 bpm, and SD = 17.9 for SB1; N = 578, ΔHR = 8.0 bpm, and SD = 20.7 for SB3, respectively with p < 0.001).
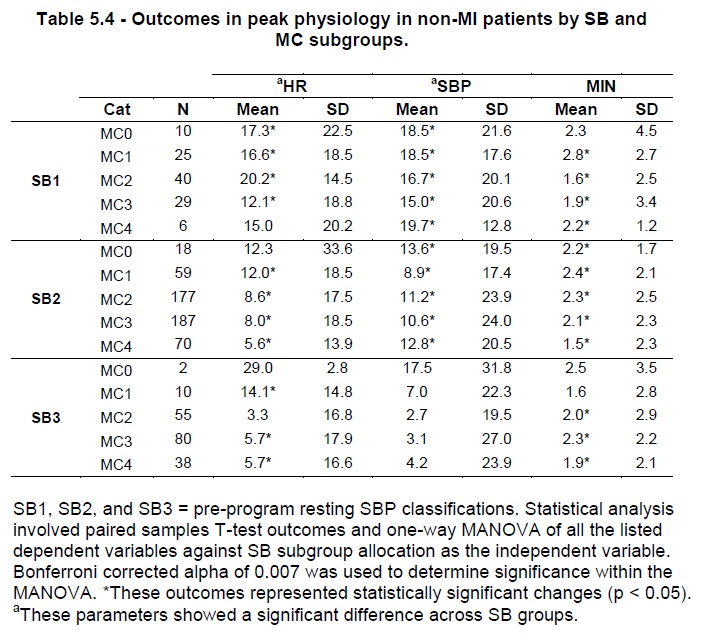
One-way MANOVA comparison of SB subgroups showed that SB subgroup allocation had an Effect size of 0.032 on Peak HR outcomes in males (Table 5.3, p < 0.001). In males: (a) within the SB1 subgroup, the greatest Peak HR increases were shown for the MC2 group (Table 5.4, N = 40, ΔHR = 20.2 bpm , SD = 14.5, p < 0.01); (b) within the SB2 subgroup, graded increases in Peak HR were achieved by MC1 (Table 5.4, N = 59, ΔHR = 12.0 bpm, SD = 33.6, p < 0.001) to MC4 (Table 5.4, N = 70, ΔHR = 5.6 bpm, SD = 13.9, p < 0.001) patients; (c) within the SB3 subgroup, significant changes in Peak HR were achieved by subgroups ranging from MC1 (Table 5.4, N = 10, ΔHR = 14.1 bpm, SD = 14.8, p < 0.05) to MC4 (Table 5.4, N = 38, ΔHR = 5.7 bpm, SD = 16.6, p < 0.05). Two-way MANOVA of Peak HR outcomes in males based on SB and MC subgroup allocations showed that SB subgroup allocation influenced Peak HR outcomes (Table 5.4, Effect size = 0.010, p < 0.05), but MC group allocation did not (p > 0.05).

Effect on Peak SBP
From SB1 to SB3 subgroups, males showed progressively lesser peak SBP increases (Table 5.3: N = 110 and ΔSBP = 17.0 mmHg, and SD = 19.2 for SB1; N = 185, ΔSBP = 3.6 mmHg, and SD = 24.0 for SB3, respectively with p < 0.001). Females also showed progressively lesser Peak HR increases ranging from SB1 to SB3 subgroups. (Table 5.3: N = 33 and ΔSBP = 20.4 mmHg, and SD = 23.7 for SB1; N = 78, ΔSBP = 2.5 mmHg, and SD = 24.7 for SB3, respectively with p < 0.001). One-way MANOVA comparison of SB subgroups showed that SB subgroup allocation had an Effect size of 0.032 on Peak SBP outcomes in males, and an Effect size of 0.059 in females (Table 5.3, p < 0.001).
In males: (a) within the SB1 subgroup, the greatest Peak SBP increase was seen in MC4 group (Table 5.4, N = 6, ΔHR = 19.7 mmHg , SD = 12.8, p < 0.05) with equal outcomes shown for MC0 and MC1 groups (Table 5.4, N = 10 and 25 respectively, ΔSBP = 18.5 mmHg, SD = 21.6 and 17.6 respectively, p < 0.01); (b) within the SB2 subgroup, increases in Peak SBP ranged from MC0 (Table 5.4, N = 18, ΔSBP = 13.6 mmHg, SD = 19.5, p < 0.001) to MC1 (Table 5, N = 59, ΔSBP = 8.9 mmHg, SD = 17.4, p < 0.001) patients; (c) within the SB3 subgroup, no changes in Peak SBP were statistically significant (Table 5.4, p > 0.05). Two-way MANOVA of Peak SBP outcomes in males based on SB and MC subgroup allocations showed that SB subgroup allocation influenced peak SBP outcomes (Table 5.4, Effect size = 0.008, p < 0.05), but MC group allocation did not (p > 0.05).

Effect on EST Minutes
From SB1 to SB3 subgroups, males showed equivalent increases in EST Minutes of ΔMins = 2.1 mins (Table 5.3: p < 0.01). Females also showed increases in EST minutes ranging from ΔMins = 1.8 mins in SB2 (Table 5.3: N = 146, SD = 2.2, p < 0.01) to ΔMins = 1.5 mins in SB3 (Table 5.3, N = 78, ΔMins = 1.5, and SD = 2.3, p < 0.01). One-way and two-way MANOVA analyses showed that neither SB nor MC subgroup allocations influence outcomes in EST Minutes.
Discussion
Overview
The current findings demonstrate: (a) SB group allocations affected outcomes in Peak HR and Peak SBP, but not in EST Minutes; (b) after correcting for SB groups, MC subgroup allocations had no further influence on outcomes on Peak HR or Peak SBP; (c) males showed progressively lower Peak HR and Peak SBP outcomes from SB1 to SB3 groups, while male outcomes in EST Minutes were very consistent across SB groups; (d) females showed progressively lower Peak SBP outcomes from SB1 to SB3, while SB2 females showed the lowest Peak HR and highest EST Minute outcomes; (e) all outcomes represented increases from pre-program values.
Important Demographics
Significant pre-program variations across SB groups were shown for age, BMI, rest SBP and DBP, peak SBP and EST Minutes. All but the last of these increased consistently from SB1 to SB3, with EST Minute outcomes decreasing from a maximal value in SB1 patients. Based on this pre-program data, patients admitted to the CR program and assessed at rest as hypertensive during pre-program assessment were generally older, had higher BMI and resting blood pressure, showed a significantly higher peak BP and achieved the lowest durations during EST testing.
Diagnosed hypertension varied as expected between SB groups in both genders. Additionally, ACEI use varied significantly in males only, while hypercholesterolemia varied only in females, based on SB groups (Table 2). However SB groups are based on the assessed BP at the time of pre-program assessment rather than a prior diagnosis of hypertension. Thus the 38.2% of SB1 male and 30.3% of SB1 female patients with previously diagnosed hypertension and assessed during pre-program testing to be hypotensive (i.e. systolic BP below 100 mmHg) are noteworthy.
The effect of medications on physiological outcomes is examined further in Chapter 12, with findings there suggesting that when taken with BB medication, ACEI use may limit peak SBP changes in both males and females. When combined with the relatively high number of hypotensive SB1 patients taking ACEI medications (38.2% of males and 42.4% of females) and with a diagnosis of hypertension, the data suggest that a review of BB and ACEI medications for patients entering CR may be necessary. This medication review may improve HR and SBP outcomes. All of the above variations help to confirm the value of SB grouping to effectively correct for as much of this multi-parameter variation as possible when analysing physiological outcomes.
Utility of SB Subgrouping
Based on SB group allocations, the present results show that Peak HR and Peak SBP varied predictably in males, while EST Minute outcomes remained consistent. In females the outcomes were similar, with more variability in EST Minute outcomes. In clinical significance terms, we can compare genders across SB groups to reveal: (a) SB1 males showed slightly more clinically significant changes in both Peak HR and EST Minutes, while SB1 females showed greater clinical changes in Peak SBP; (b) normotensive SB2 males and females showed similar physiological outcomes, although male outcomes appear to be of greater clinical significance; (c) female SB3 patients showed more clinically significant changes in Peak HR than Peak SBP, while male SB3 patients showed changes of lesser clinical significance in Peak HR but slightly higher Peak SBP outcomes.
While pre-program Peak SBP varied between SB groups in males and females, Peak HR did not vary significantly in either gender based on the one-way MANOVA results in Table 5.3. Furthermore, although pre-program EST Minutes varied between SB groups in males, the variation in females was not statistically significant. These pre-program demographics make the consistency of EST Minute outcomes in males noteworthy, particularly when compared with the statistically significant EST minute outcomes in females despite no pre-program differences in this parameter between female SB groups.
Earlier evidence [172] demonstrated that peak SBP and DBP, and changes in these from rest, are all higher in men during maximal treadmill EST and increasing with advancing age. Differences in EST parameters including peak HR and HRR1 between genders have been shown, and may partially explain differences in exercise capacities [173]. Another important factor to consider is the effect of overweight and obesity on these outcomes, with other results [174] showing that exercising on the treadmill while carrying loads (15 and 20 kg) produces fatigue quicker in women, and increases the risk of adverse cardiovascular events more significantly in females. Evidence suggests that the HR-corrected QT interval (QTc) is longer in females, but QT dispersion (QTd) is higher in males, based on EST in hypertensive patients [175]. Autonomic regulation has also been shown to differ significantly between genders [176], with a dominance of sympathetic vascular regulation in men and parasympathetic regulation of HR in women.
Utility of MC Subgrouping
While MC subgroup allocations had a statistically significant effect on Rest SBP outcomes in non-MI patients (Chapter 4) when combined with SB group allocation, the present findings show that there was no significant difference in Peak SBP or Peak HR based on these same allocations. However MANOVA analysis does not reveal the apparent and clinically significant stratification of Peak HR and EST Minute outcomes in SB2 Males based on MC subgroups. Such stratification demonstrates a predictable trend in outcomes based on MC classification, confirming both differential impacts and the utility of MC grouping to the interpretation of clinical outcomes.
Peak Physiologic Outcomes
Evidence suggests that exercise can improve flow-mediated dilation (FMD) in CAD patients [177], and that combined hypertension and DM somewhat limit changes in FMD, but not necessarily fitness, body composition or glycaemic control [153]. Further complicating the interpretation of Peak SBP outcomes are results in healthy individuals suggesting that a negative relationship may exist between exercise intensity and FMD [178]. Normotensive males with Met-S have also been shown to demonstrate exercise-induced hypertension (EIH), with the best predictors of EIH occurrence being resting SBP (i.e. the basis of the SB grouping) and abdominal obesity [179]. Unclear stratification of Peak SBP outcomes in the current findings may also be due to the effects of Met-S on LV morphology independent of age and gender [180], with LV systolic dysfunction further compounded in hypertensive patients [181]. Met-S may also complicate many homeostatic mechanisms as we have discussed previously, including autonomic function and in particular sympathetic mechanisms [182] potentially affecting CVS function.
Furthermore the present MC classification system requires clarification of the differing effects of various combinations of comorbidities, which is a limitation of the current study. Analysis of larger sample sizes in similar manner would provide greater statistical power for more in-depth analysis.
Outcomes in Peak HR and Peak SBP demonstrate that hypotensive SB1 patients showed the greatest increases, while SB3 males showed the lowest changes. The only exceptions were female SB2 patients, which showed the lowest Peak SBP outcomes in females. Males showed remarkably consistent post-program increases in EST Minutes across SB groups. The current findings suggest we can confidently expect an average increase of 2.1 minutes in the EST time post-program with the current IT protocol in male MI patients based on SB grouping. However this consistency was not demonstrated by females.
A significant gender difference in postural autonomic function with reduced BRS in both genders with age [183] has been suggested. Although the cardiac output and VO2max relationship is similar in both genders at lower exertion levels, the actual slope of the linear regression is different and men show overall higher VO2max increases at higher levels of exertion [184] for the same increase in cardiac output. However, female gender has been shown to be a predictor of better LV function in hypertensive patients with LV hypertrophy [185]. Other factors such as pulmonary arterial hypertension [186] may compound autonomic dysfunction resulting in an exaggerated reduction in chronotropic response to exercise (i.e. peak HR) and HRR1. Thus all of these additional factors may be contributing to some of the observed differential outcomes between genders.
Implications for Clinical Practice
The findings appear to be positive prognostically since patients are able to tolerate elevated peak HR and SBP, and increased EST time. These results are in line with other data [187] showing that some modes of exercise training may increase maximal HR and VO2 max after weight loss, for example. However an important question arises from an exercise physiology perspective. Is it desirable to sustain elevated peak physiology for relatively small increases in exertion time and intensity?
One may instead aim to increase the workload while maintaining or even reducing (where appropriate) peak physiological measures. This would signal better physiological efficiency during exertion and may be more desirable in a rehabilitation context. In the above discussion we outlined how factors corrected for in the present study can affect peak physiology outcomes with the current IT protocol. Yet other important factors may also be contributing to the increased peak physiology observed in the present data post-program. Breathing dynamics such as tidal volume and respiratory rate [188] are important considerations and have been shown to impair functional capacity in CHF patients.
Met-S may compromise FEV1 and FVC, but not FEV1/FVC ratio [57]. This suggests that Met-S may lead to the development of restrictive lung disease in susceptible individuals. One potential mechanism for this association is inflammation, directly impacting the gas exchange across the alveolar epithelia and pulmonary capillary wall. Respiratory muscle training [189] has been shown to improve exercise capacity in healthy individuals, with greater improvements in those less fit at baseline. The potential benefit(s) of respiratory system training in clinical CR contexts is unclear at the time.
Conclusion
Novel trends were demonstrated in peak physiologic outcomes in non-MI patients based on SB and MC group allocations, suggesting they may be useful in the interpretation of outcomes in clinical CR settings. Furthermore, the changes in peak HR and post-program peak SBP represented increases across all subgroups in both genders.
