Resting Outcomes in Non-MI
Results
Quick Tips for In-School Science: So why should all these numbers interest you? I mean seriously... major turn off, right?
Although they look really boring, the numbers and tables show us some pretty important things for rehabilitating patients with heart disease and heart attacks using exercise (in this case, aerobic interval training).
To be honest I really... umm, how should I put this... 'dislike' statistics myself, but I had to do it... honest... to find the answers that I suspected or knew were hiding in there.
Don't judge! 🙂
Heads up - Blood pressure is measured in two parts, one called 'systolic' or SBP which is how high the pressure is when the heart actually 'beats'... and is always higher than... yep, 'diastolic' or DBP pressure, which is the 'background' pressure of blood in the arteries and veins when the heart isn't beating. And pressure in the arteries (which is what we measured here using a normal blood pressure cuff, at the 'brachial' artery near the elbow) is always higher than in veins. I know... cool right? Or... not? We agreed... no judging 😉
Remember to look for the 'Simplified Summary' bits after maybe-kinda-sorta freaking out at the other bits.
Key Demographics
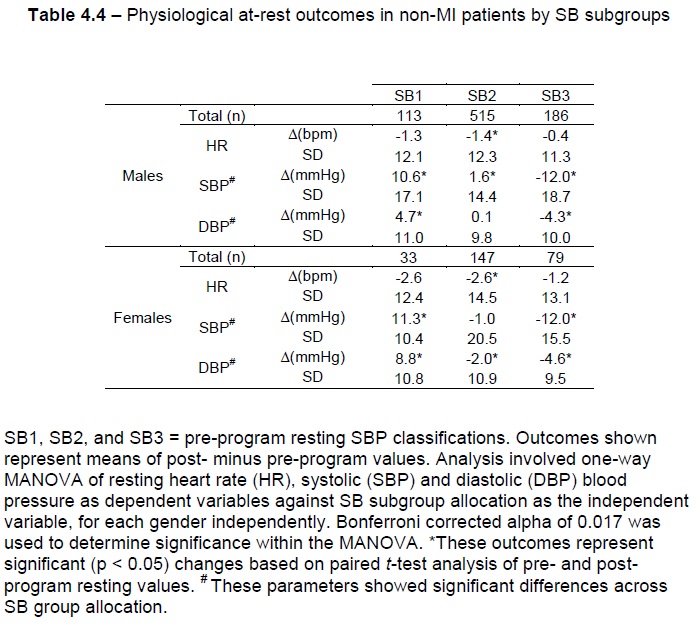
The completion rate for all those who attended the program (N = 4202) was 61.0% (Table 4.1, N = 2532). Males made up the majority of the sample (N = 3226) representing 78.5% of patients analysed (Table 4.1). Average age of all patients was 61.8 years (Table 4.1, SD = 10.8 yrs), Patients with no history of MI represented 41.9% (Table 4.1, N = 1724). Binomial logistic regression analysis using all of the independent variables shown in Table 4.1, with program completion as the dependent variable, showed that the full model containing all predictors was statistically significant (p < 0.001), explaining between 5.8% (Cox & Snell R2) and 7.8% (Nagelkerke R2) of the completion rate, and correctly classifies 63.8% of cases with a sensitivity of 24.8% and a specificity of 89.0% (Table 4.1). Factors which showed a significant contribution to the overall model included age, gender, MI classification, hypercholesterolemia, diabetes, family history and sedentary lifestyle (Table 4.1, p < 0.001).
Simplified Summary
- Most of the patients were males (78.5%) and 61% of all the patients completed the CR program;
- On average, patients were around 61.8 years old, and 41.9% of patients hadn't suffered an MI;
- If you considered all the factors shown in Table 4.1 to try and predict who would complete the program, particularly those listed at the end of the paragraph above, you could probably explain between 5.8% - 7.8% of the drop-outs.
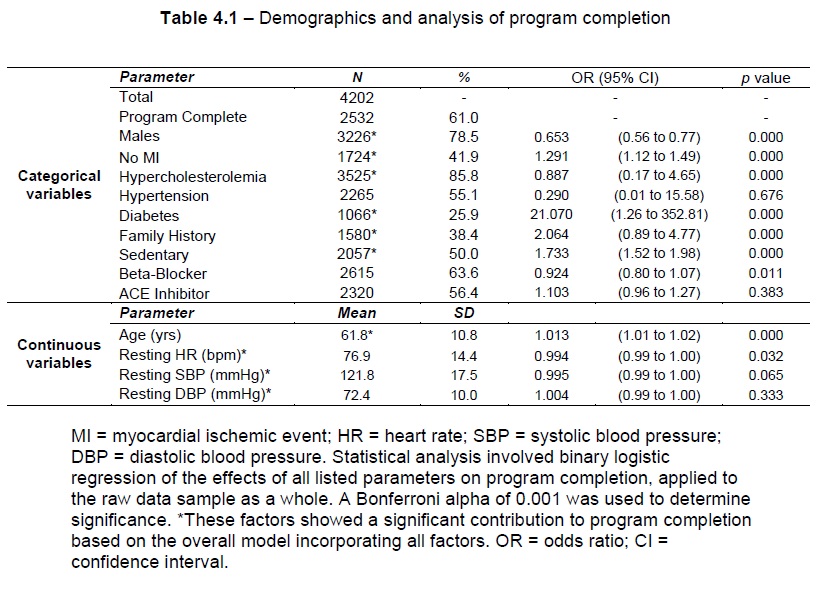
Hypertension and angiotensin converting enzyme inhibitor (ACEI) use varied significantly across SB subgroups in males, while hypercholesterolemia and hypertension varied significantly between SB subgroups in females (Table 4.2, p < 0.05). Gender-based multinomial logistic regression using all of the independent variables shown in Table 4.2, with SB subgroup allocation as the dependent variable, showed that the full model containing all predictors was statistically significant in males (p<0.001) and females (p<0.001), with the model explaining 6.2% to 7.4%, and 11.2% to 13.1% (Cox & Snell R2 and Nagelkerke R2) of the variance in SB subgroup allocations in males and females respectively. Only the prevalence of hypertension diagnosis contributed significantly (p < 0.001) to SB subgroup allocation in either gender (Table 4.2).
Simplified Summary
- When you look at the differences between SB subgroups in Table 4.2 (which tell you what level the pateints' measured pre-program resting SBP was - how high their resting blood pressure reading was at the start of the program), there were some differences in particular factors in the table, and these varied a bit between males and females;
- If you considered all the factors in Table 4.2 to try and predict which SB group a patient was in, you'd have a better chance of predicting which groups females were in than males (but probably not because we're more mysterious or anything... just science wise... in this case... specifically... cool?);
- Considering each factor by itself, the only factor that showed a significant impact on SB subgroup allocation was pre-program hypertension diagnosis (i.e. if the patient had been assessed and told by their doctor that they had high blood pressure, not the assessment of their blood pressure when they attended the program - which are two different things, and that's important).
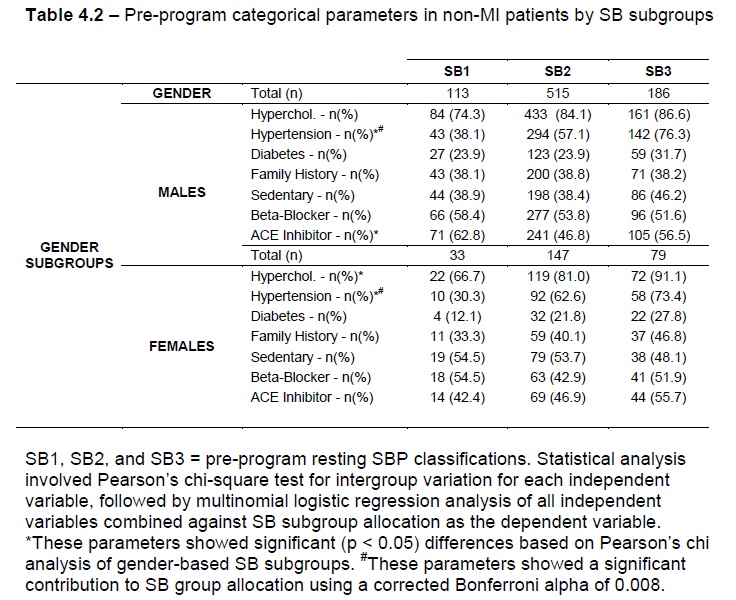
Table 4.3 summarises the continuous demographic variables (age, BMI, and resting HR and DBP) for the data sample in the present study based on gender and SB subgroups. In males and females, resting DBP and age variables showed significant variance across SB subgroups, while resting HR in females and BMI in both genders showed no significant variance (using a Bonferroni adjusted alpha value of 0.01). One-way MANOVA analysis, using SB subgroup allocation as the dependent variable and the continuous demographic parameters above as the independent variables, showed that following resting DBP, age represented the greatest predictor in the overall model in both genders (Table 4.3, Effect size = 0.053, p < 0.001 in males, and Effect size = 0.150, p < 0.001 in females, respectively). The model showed a statistically significant difference between SB subgroups based on the combined dependent variables in males (Effect size = 0.195, and p < 0.001) and females (Effect size = 0.241, and p < 0.001).
Simplified Summary
- Table 4.3 shows us some of the values for the things we want to measure, but BEFORE the exercise program (so we can compare with later values... you'll see)... EXCEPT you'll notice there isn't a value for SBP, because that's what we used to form the SB groups, so of course it would be different between the three groups, right?;
- There were some differences again between the groups (just look for the asterisks-s-s, with the explanations in scientifically important 'geek-speak' at the bottom of the tables each time);
- After resting DBP, the average age was the biggest difference between the groups in males and females (i.e. those with higher resting SBP values before the program were likely to be older).
Effect on Resting HR
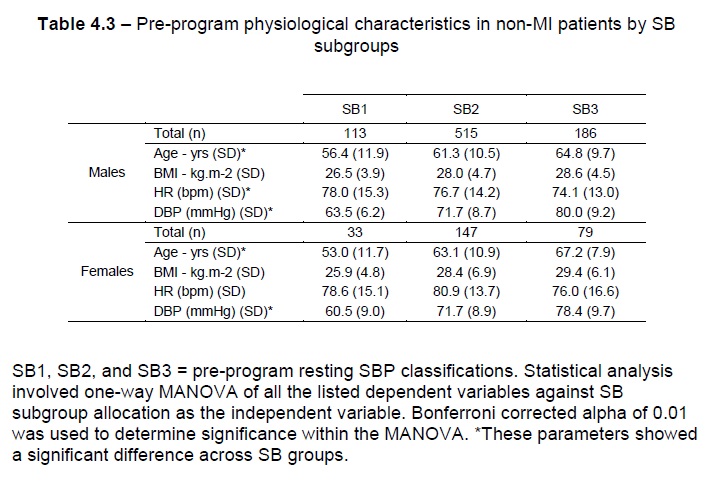
Significant HR reductions were observed in males classified as SB2 (Table 4.4, N = 515, ΔHR = -1.4 bpm, p < 0.05) and females classified as SB2 (Table 4.4, N = 147, ΔHR = -2.6 bpm, p < 0.05). One-way MANOVA comparison of SB subgroups for resting HR outcomes showed no significant differences in either gender (Table 4.4, p > 0.05).
Effect on Resting SBP
Males classified as SB1 and SB2 showed resting SBP increases (Table 4.4, N = 113 and ΔSBP = 10.6 mmHg, and N = 515 and ΔSBP = 1.6 mmHg, respectively with p < 0.001). Males classified as SB3 showed a reduced SBP (Table 4.4, N = 186, ΔSBP = -12.0 mmHg, p < 0.001). Females classified as SB1 showed increased resting SBP (Table 4.4, N = 33, ΔSBP = 11.3 mmHg, p < 0.001) whilst it was reduced in females classified as SB3 (Table 4.4, N = 79, ΔSBP = -12.0 mmHg, p < 0.001). One-way MANOVA comparison of SB subgroups showed that SB subgroup allocation had an Effect size of 0.166 on resting SBP outcomes in males and 0.141 in females (Table 4.4, p < 0.001).
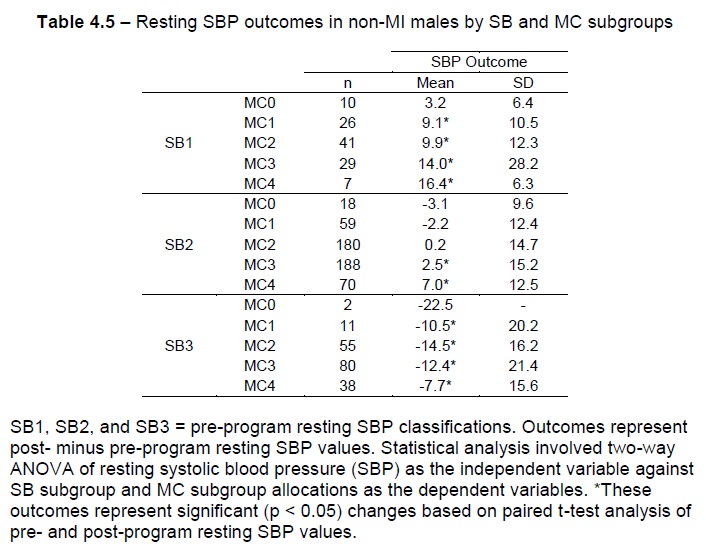
In males: (a) within the SB1 subgroup, graded resting SBP increases were shown for groups progressing from MC1 (Table 4.5, N = 26, ΔSBP = 9.1 mmHg , SD = 10.5, p < 0.01) to MC4 (Table 4.5, N = 7, ΔSBP = 16.4 mmHg, SD = 6.3, p < 0.01); (b) within the SB2 subgroup, significant changes in resting SBP were achieved by MC3 (Table 4.5, N = 188, ΔSBP = 2.5 mmHg, SD = 15.2, p < 0.001) and MC4 (Table 4.5, N = 70, ΔSBP = 7.0 mmHg, SD = 12.5, p < 0.001) patients; (c) within the SB3 subgroup, significant changes in resting SBP were achieved by subgroups ranging from MC1 (Table 4.5, N = 11, ΔSBP = -10.5 mmHg, SD = 20.2, p < 0.05) to MC4 (Table 4.5, N = 38, ΔSBP = -7.7 mmHg, SD = 15.6, p < 0.01). Two-way ANOVA applied to resting SBP outcomes in males based on SB and MC subgroup allocations showed that both SB (Table 4.5, Effect size = 0.067, p < 0.001) and MC (Table 4.5, Effect size = 0.014, p = 0.02) allocations showed significant variance in resting SBP outcomes.
Effect on Resting DBP
Males classified SB1 showed resting DBP increases (Table 4.4, N = 113, ΔDBP = 4.7 mmHg, SD = 11.0, p < 0.001), while those classified SB3 showed a reduced resting DBP (Table 4.4, N = 186, ΔDBP = -4.3 mmHg, SD = 10.0, p < 0.001). Females classified SB1 showed increased resting DBP (Table 4.4, N = 33, ΔDBP = 8.8 mmHg, SD = 10.8, p < 0.001) whilst it was reduced in females classified as SB3 (Table 4.4, N = 79, ΔDBP = -4.6 mmHg, SD = 9.5, p < 0.001). One-way MANOVA comparison of SB subgroups for resting DBP outcomes showed significant differences in both males (Table 4.4, Effect size = 0.067, p < 0.001) and females (Table 4.4, Effect size = 0.133, p < 0.001,).
Simplified Summary
- There were statistically significant (i.e. the analysis of numbers only, using statistics) average reductions in HR in males and females, but they were pretty slight in terms of real life... as in real values, that we would call 'clinically significant' changes or outcomes for patients;
- When you compared SB subgroups, DBP was raised after the program in SB1 patients (i.e. those with low blood pressure at the beginning) and lowered in SB3 patients (i.e. those with high blood pressure at the beginning);
- Probably the most interesting thing to come out of all the pretty geeky (but cool... way cool!) stuff... when you compare patients after grouping them into SB groups, and then dividing each of those groups AGAIN into smaller MC groups, the picture changes again, and we see some more... 'ranking' sort of... called stratification, of the changes, which we're seeing here for the first time in like... ever! I know... how cool is that people! Maybe not "I now love statistics" cool, but at the very least... a "might be worth another look" cool. Hopefully.
