Learning/Working Vibes 💼
Before I unleash all the geek tonight, I thought I'd share an awesome background track for study like the one I've linked from Quiet Quest to the left.
As for the science below, proceed with caution.
And for God's sake, don't see what's making that noise outside. Never ends well !
All The Hidden Memories
I've been repressing my memories of that dark time in my life when I actually enjoyed bringing down the evils of science upon humanity in a viscous assault on Friday nights (and every other night tbh, I was just that bad). The link to all that unholy nerdish is over there.. to the right... yep, that one.
And if for some reason, you happen to be one of those freaks that still wants to know everything about the subgroups I used and why, even after I've warned you and suggested a game of Halo, pizza and chocolate instead, then sure... they're over to the left.
But don't look at me when you click. I'd rather remember you as you are. Before the demon.
Peak Changes in Non-MI
I don't believe I'm doing this and playing devil's advocate, but I may as well remind you guys that non-MI means patients who haven't had a myocardial infarction (damage to the heart's muscle), but are still at high risk. The link to all the geek-speak of these results is to the right.
And if you click on that link, you're a bigger freak than the guy who did all that science too, and deserve everything you get.
I'm afraid to look... tell me what happens 🥴

The main new trends found in this study, based only on SB subgroups, were:
- From hypotensives (SB1, low resting blood pressure), to normotensives (SB2, normal resting blood pressure) and on to hypertensives (high resting blood pressures), the changes in PEAK blood pressures went from highest to lowest outcomes - seen in Table 5.3 at the link above;
- Similar trends were seen in peak HR across the same groups (with a slight difference in female subgroups);
- The increase in the total time that patients were able to improve in their stress testing was more consistent, especially in males (although the variations in females were also not too high).
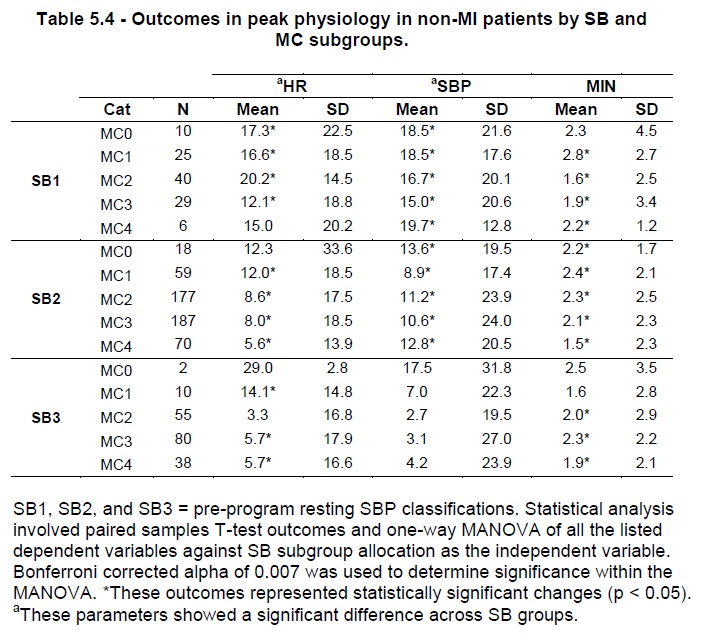
But then, when you look at Table 5.4 above and see the combined SB and MC subgroups, you can see the clearer trends in Peak HR and MIN (stress testing minutes) especially evident in the SB2 (normotensive) band. Notice how the MC subgroups in these SB2 bands show clearer stratification on Peak HR and MIN values, but less clear in other bands and subgroups for the other outcomes, which are still significant but all sorts of messed up (probably just for the fun of it)? 🤯
Of course, science is revealing these novel trends to you in order to mess with you and devour your brain-thingies.
I mean sure, there's value in these results, and yes, they do deserve to be investigated further. BUT NO! Don't do it! Don't give in to the demands of rational thinking. Fight the urge to understand why. Because if you go down that path peoples, your minds may never come back. For the sake of all that is Friday night binge, run!
Scientists - they're out there - and educating - like FREAKS, but evil-er because they like it more than Squid Game 😲
Stay awesome, and be afraid,
EMH

