Bar Indicators & Chart Graphics
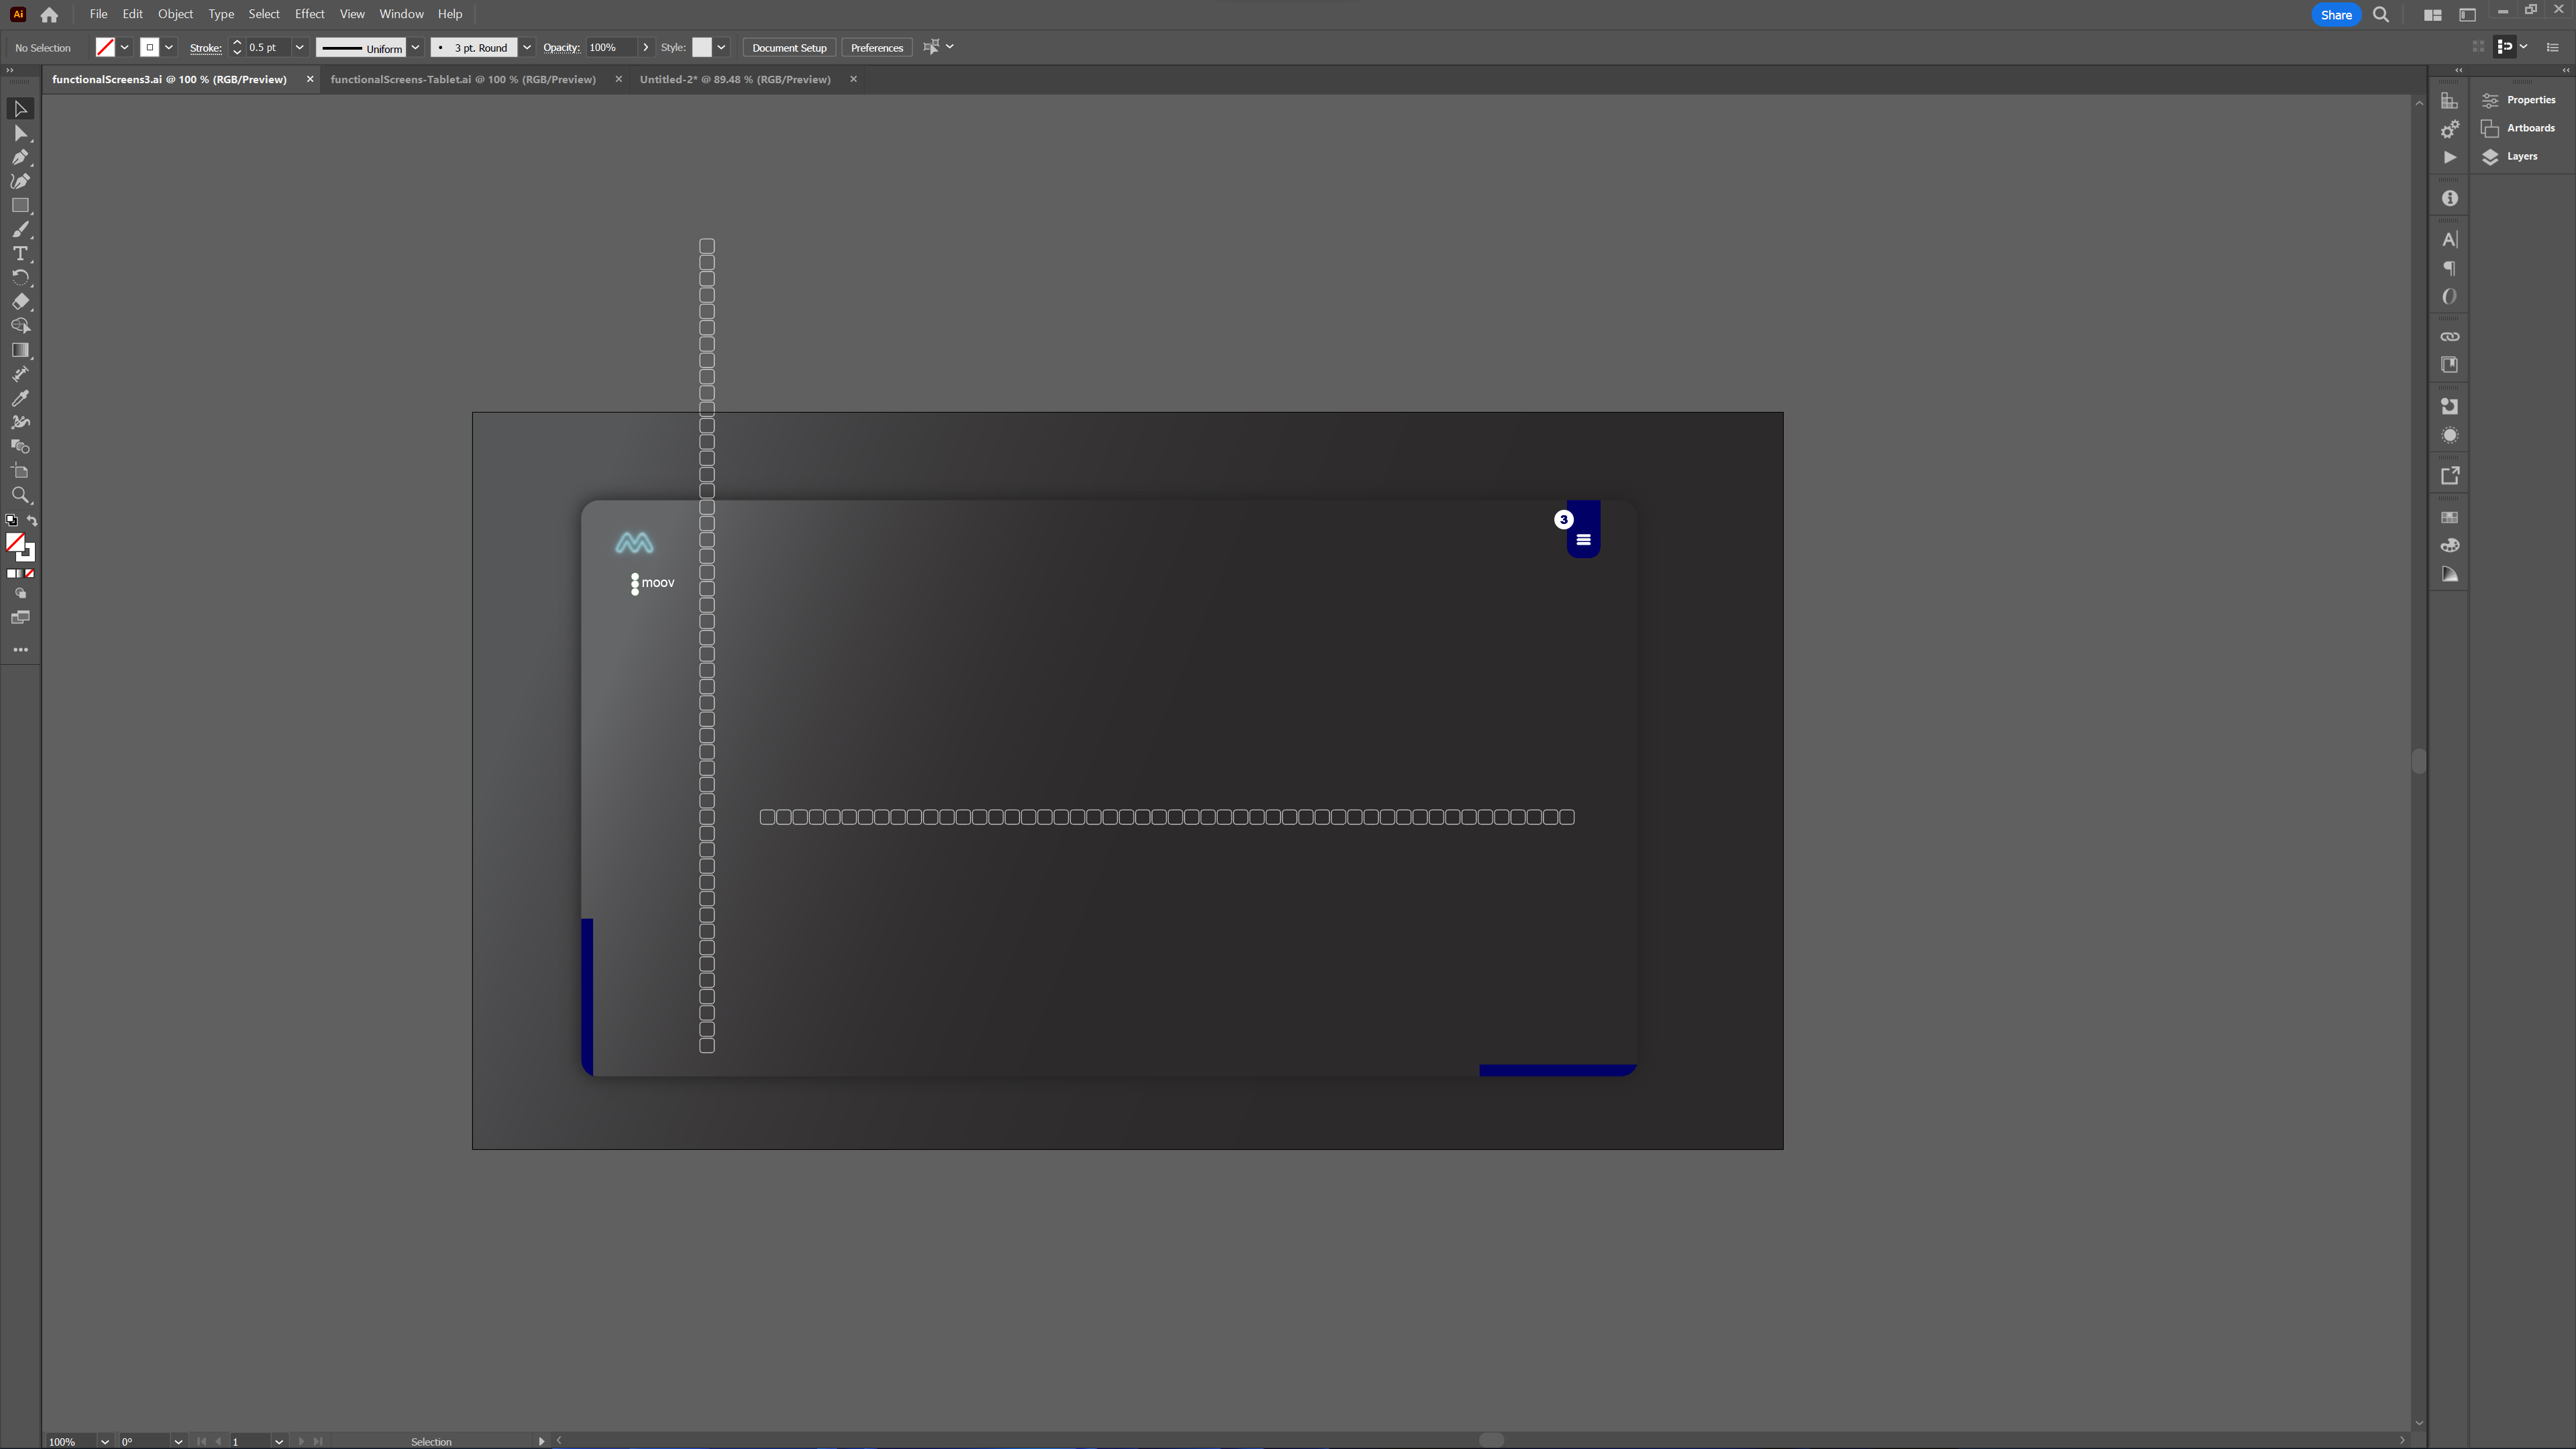
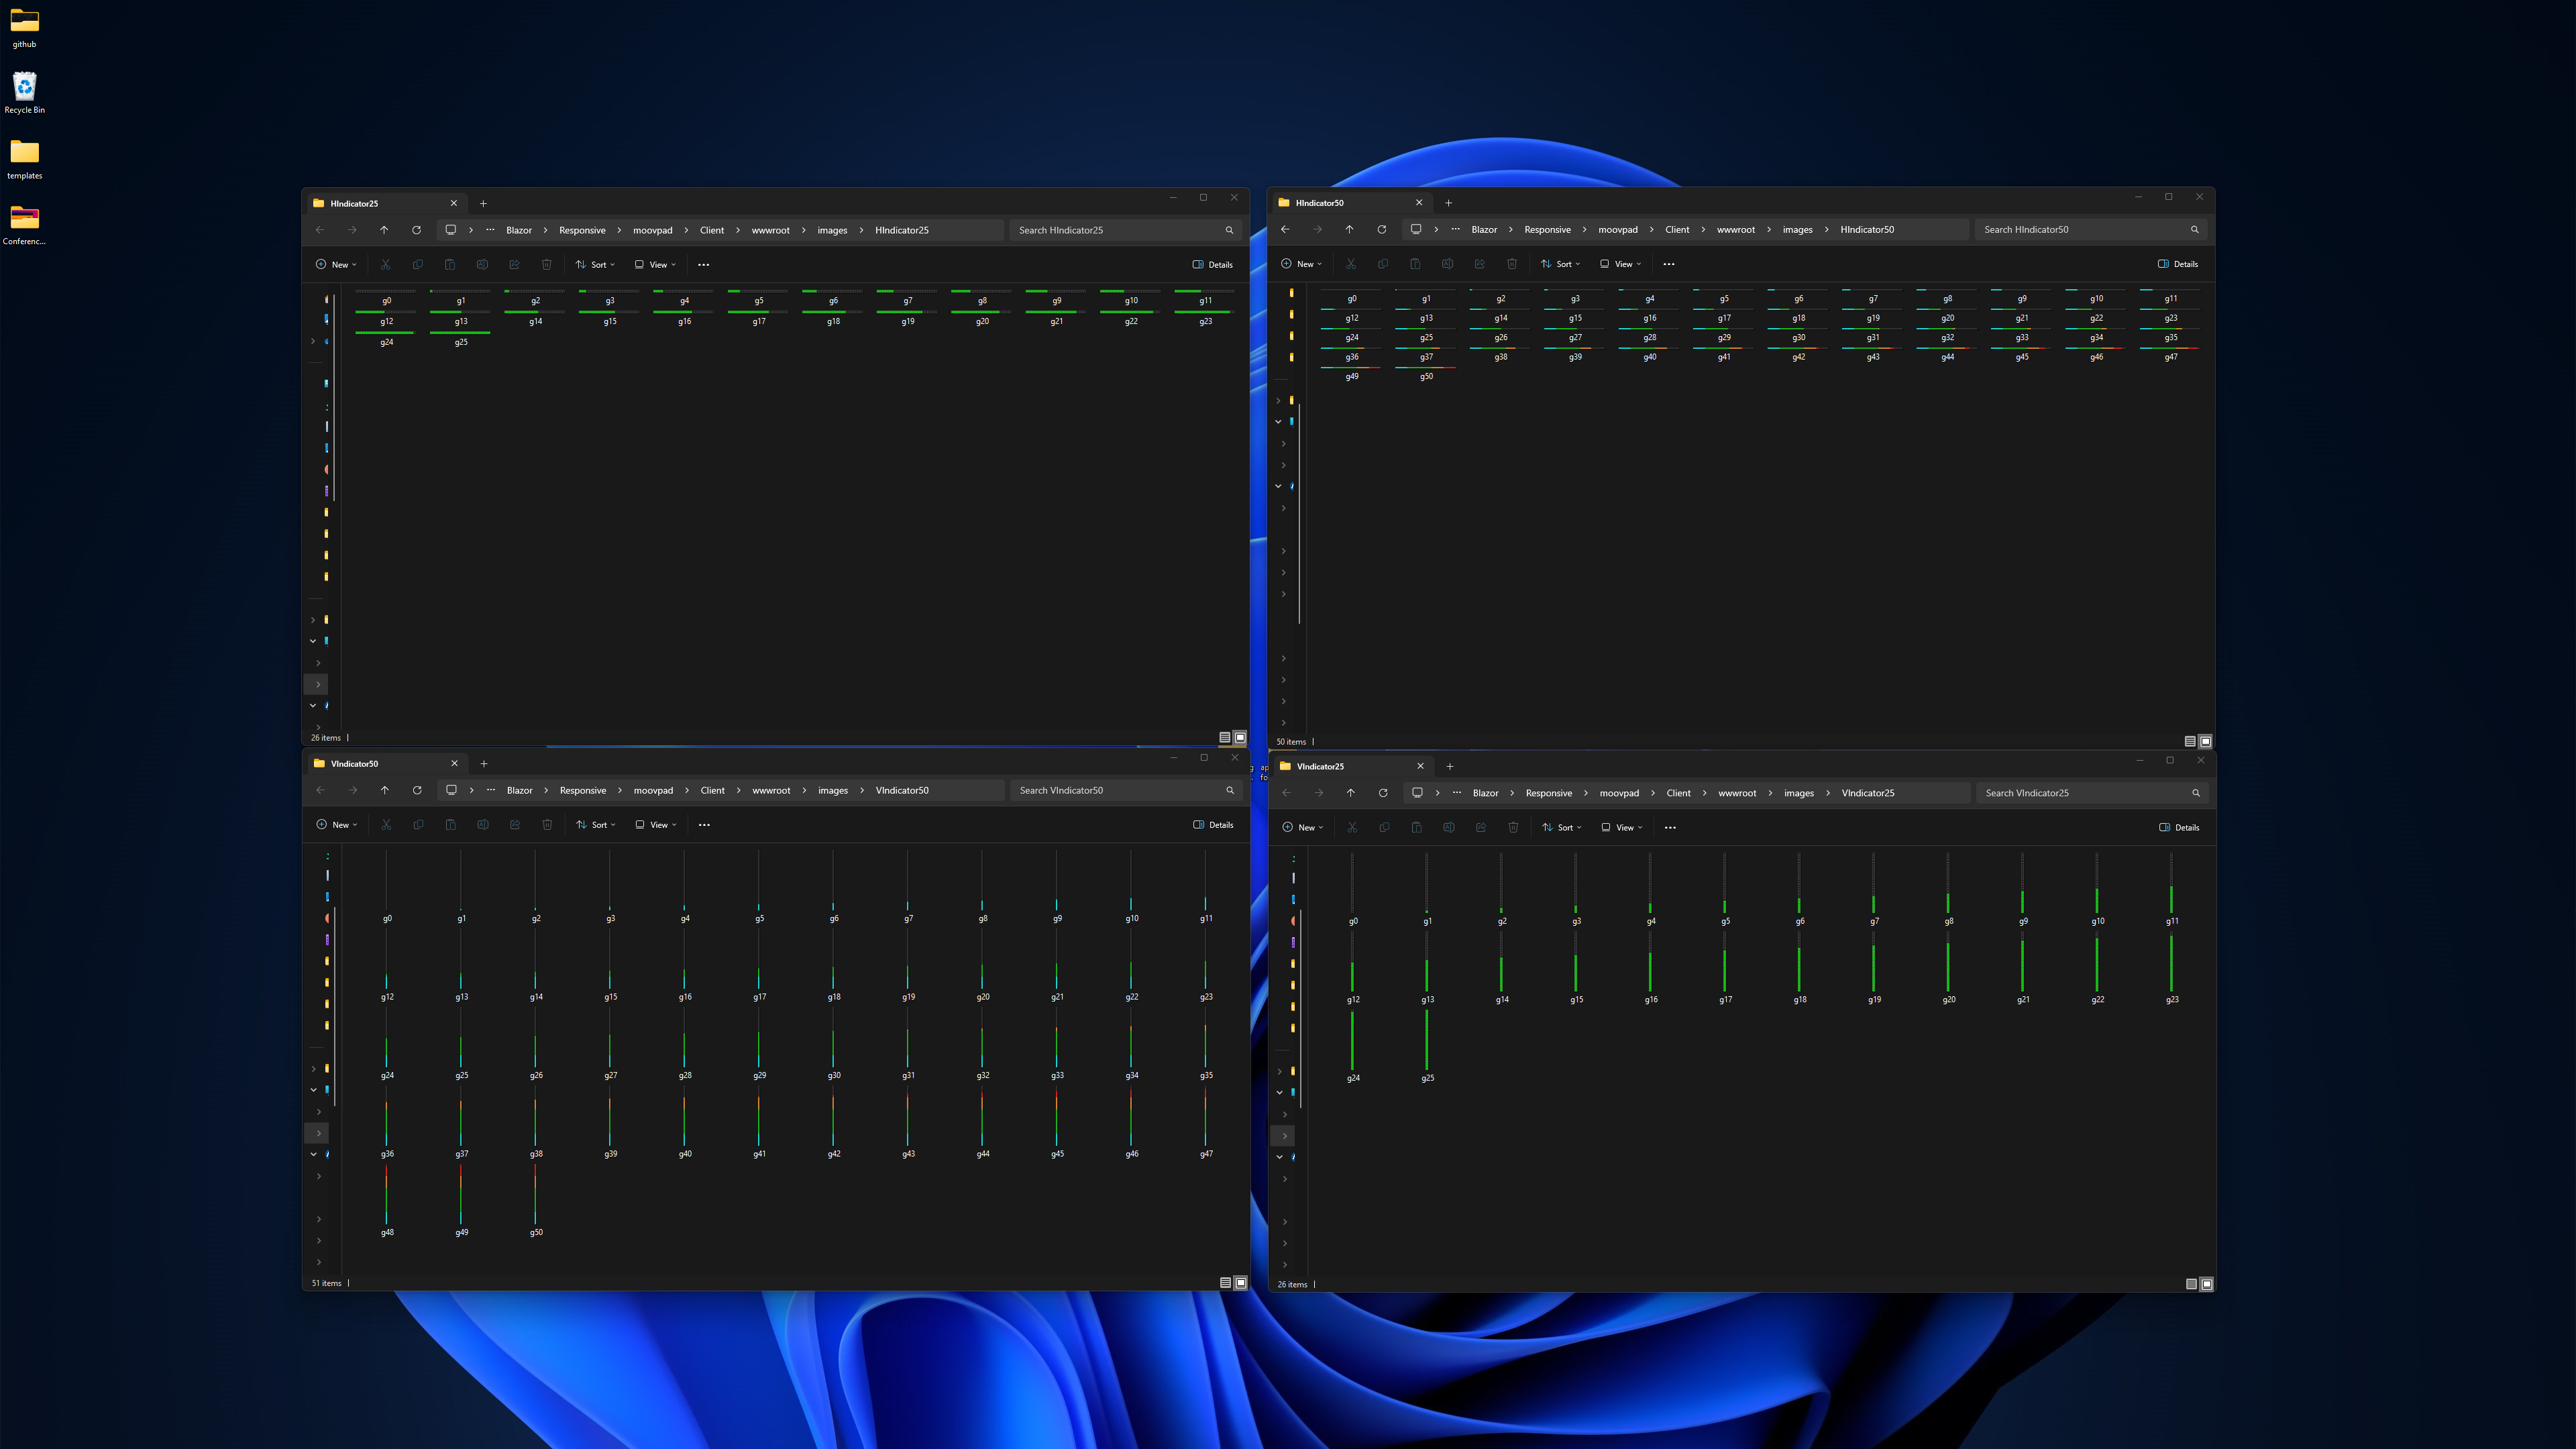
Through exhaustive scientific research and relentless personal effort, I have redefined what it means to have no life. Yes folks, you can all rejoice in the confirmed fact that your life is most definitely more lively than mine. For this is how I'm spending my weekend... monotonously producing graphics for a set of indicators and charts to make the MOOVPAD Web App look better for you guys when you use it. You're welcome.

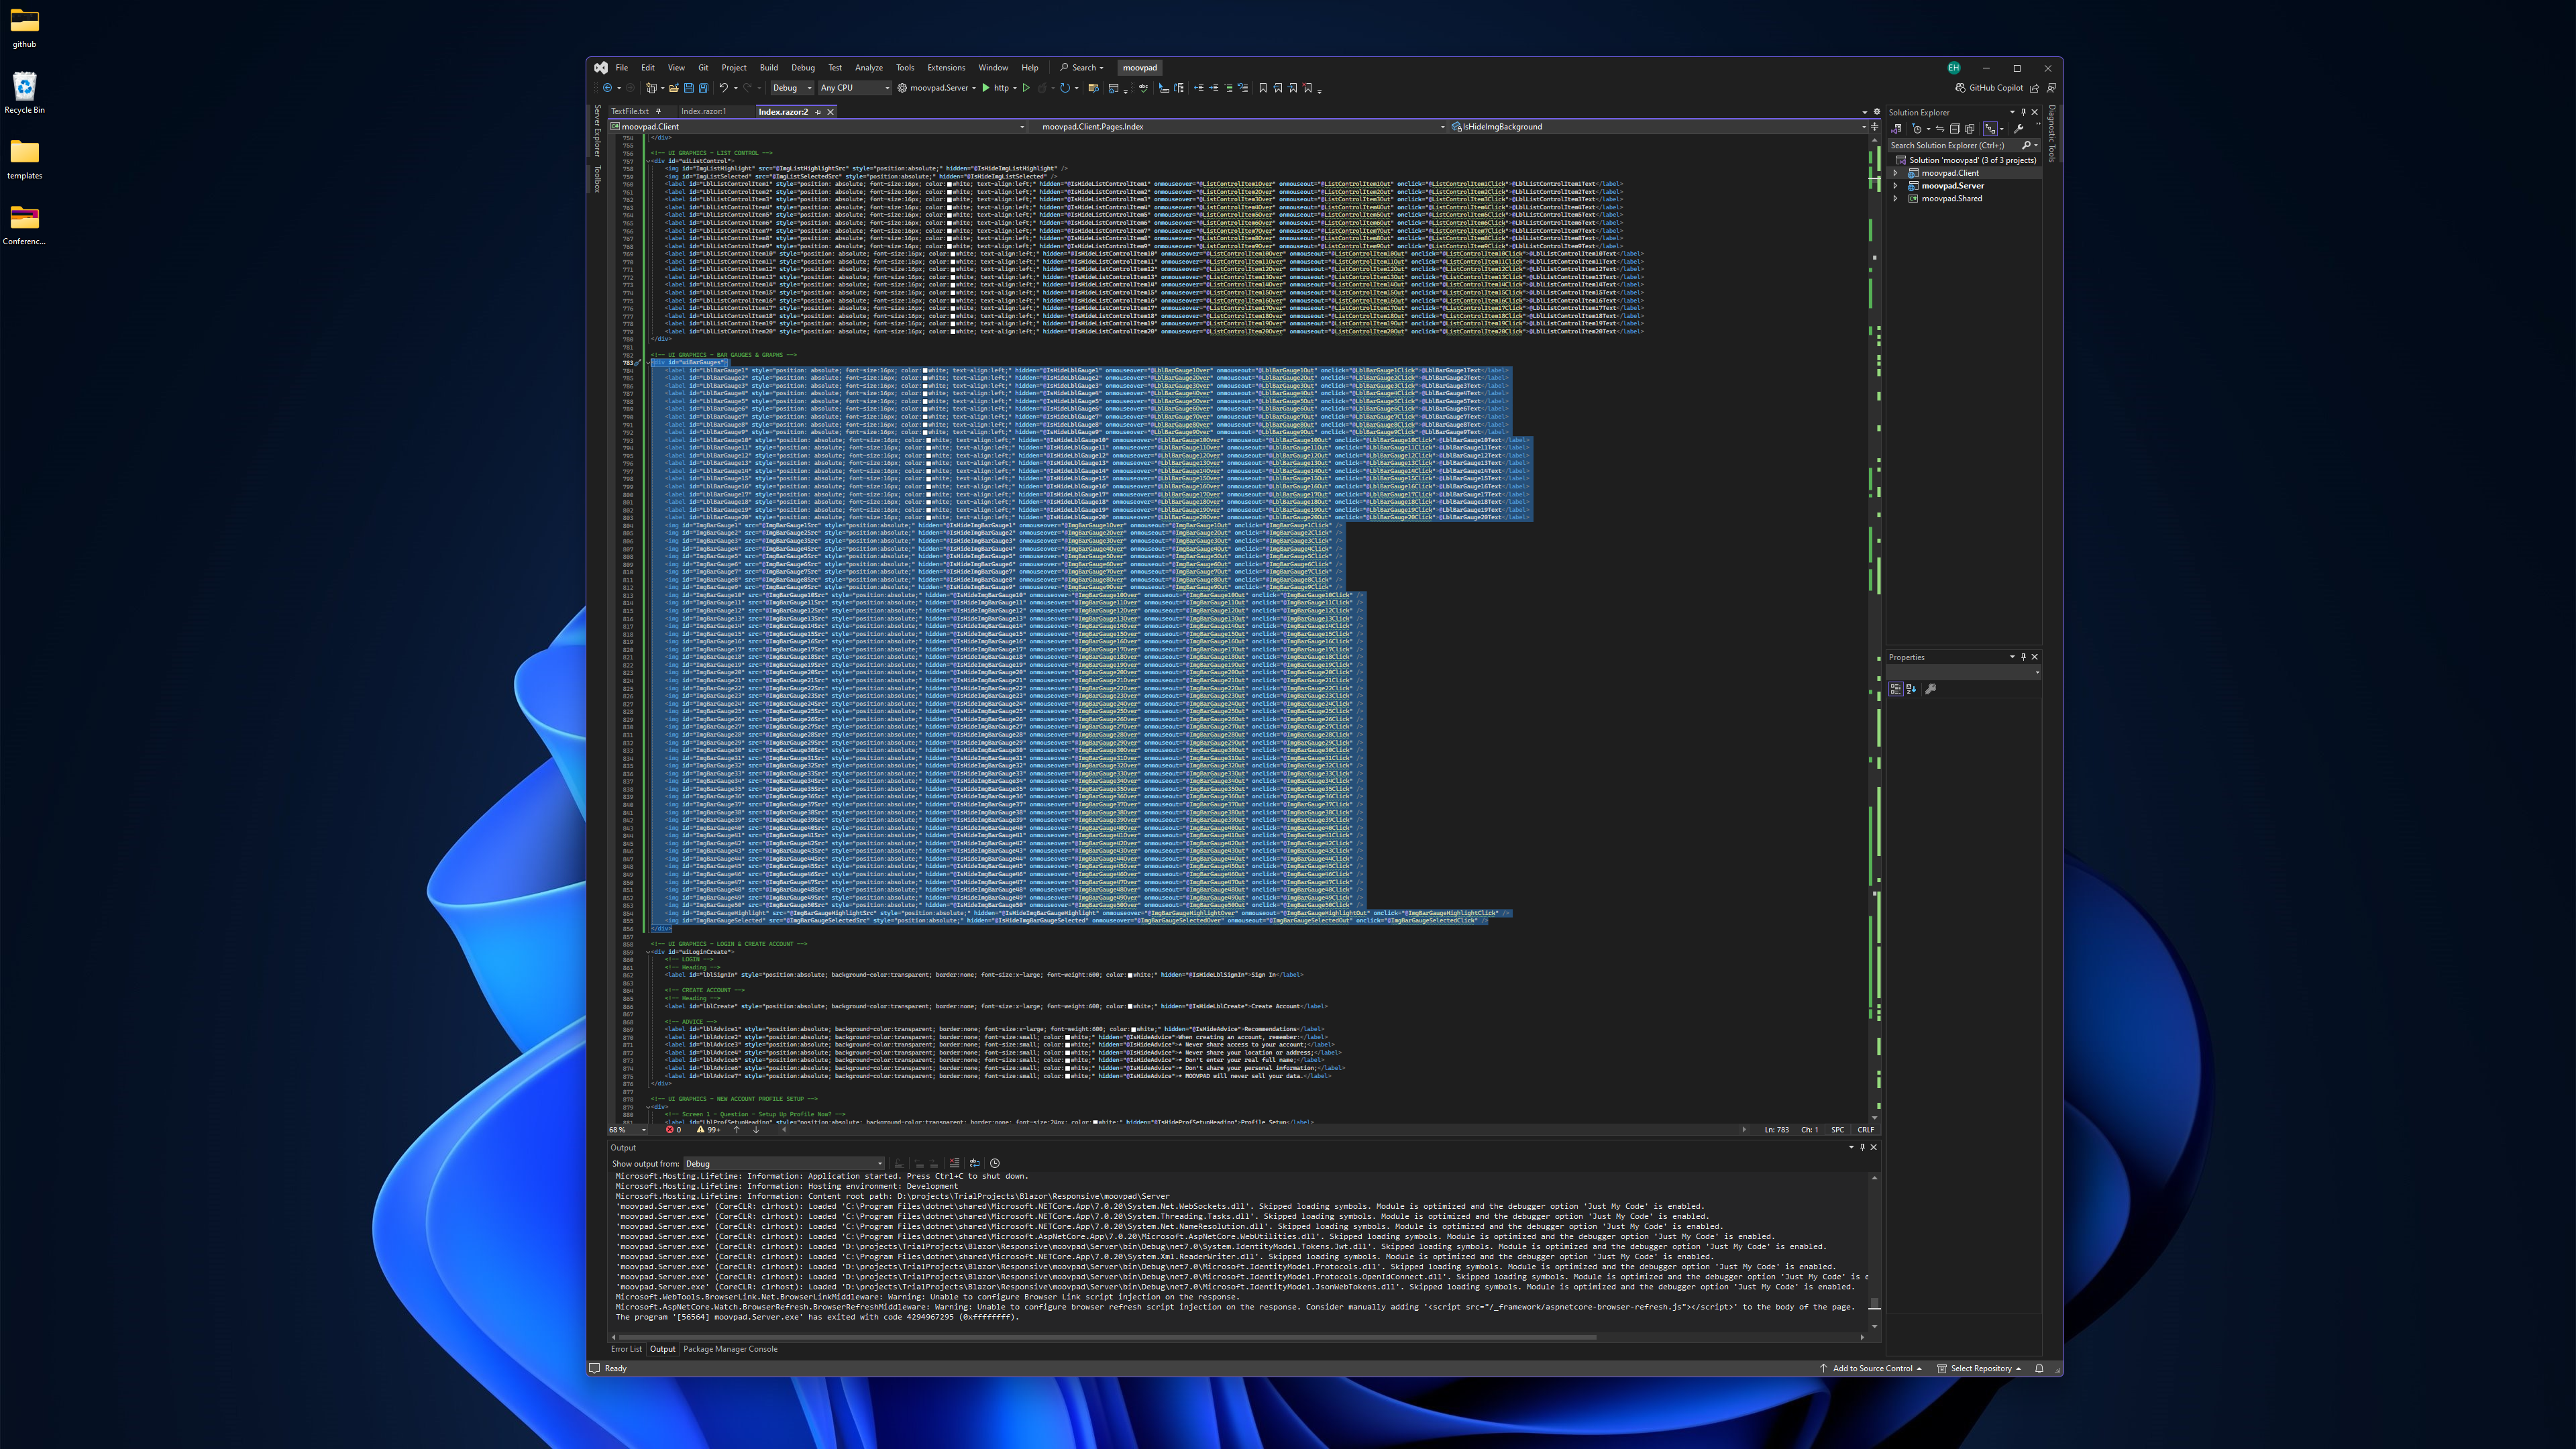
Seriously though, the reason I'm doing it this way rather than using individual gradations that can have one of 4 or 5 coloured options is because that approach would need much more markup along with the necessary variable declarations and UI code. When weighing up the options, I believe this will lead to quicker load times for users.
Work continues on another set of gauges today 🙂
Stay awesome,
EMH

HOW MOOVPAD IS BEING BUILT
For the overview of how MOOVPAD apps are being developed, the reasoning behind particular decisions during development, policies, and more in relation to all the technical things, please see the link to the left.
This will be an ongoing work in progress, and will always be linked to the bottom of each upcoming Blog post.
